a 129 Search Results


94
Miltenyi Biotec anti human cd235a apc
Anti Human Cd235a Apc, supplied by Miltenyi Biotec, used in various techniques. Bioz Stars score: 94/100, based on 1 PubMed citations. ZERO BIAS - scores, article reviews, protocol conditions and more
https://www.bioz.com/product/a+129/CD235a+(Glycophorin+A)+Antibody%2C+anti-human%2C+REAfinity/pmc08864192-268-32-37
Average 94 stars, based on 1 article reviews
anti human cd235a apc - by Bioz Stars, 2026-10
94/100 stars
  Buy from Supplier

94
Miltenyi Biotec apc conjugated nti cd86
Apc Conjugated Nti Cd86, supplied by Miltenyi Biotec, used in various techniques. Bioz Stars score: 94/100, based on 1 PubMed citations. ZERO BIAS - scores, article reviews, protocol conditions and more
https://www.bioz.com/product/a+129/CD86+Antibody%2C+anti-mouse%2C+REAfinity/10__1002_slash_advs__202522278-298-5-8
Average 94 stars, based on 1 article reviews
apc conjugated nti cd86 - by Bioz Stars, 2026-10
94/100 stars
  Buy from Supplier

92
Miltenyi Biotec anti human s100a8 rea917 pe

Anti Human S100a8 Rea917 Pe, supplied by Miltenyi Biotec, used in various techniques. Bioz Stars score: 92/100, based on 1 PubMed citations. ZERO BIAS - scores, article reviews, protocol conditions and more
https://www.bioz.com/product/a+129/S100A8+Antibody%2C+anti-human%2C+REAfinity/pmc08809252-106-0-5
Average 92 stars, based on 1 article reviews
anti human s100a8 rea917 pe - by Bioz Stars, 2026-10
92/100 stars
  Buy from Supplier

95
Miltenyi Biotec tnf α

Tnf α, supplied by Miltenyi Biotec, used in various techniques. Bioz Stars score: 95/100, based on 1 PubMed citations. ZERO BIAS - scores, article reviews, protocol conditions and more
https://www.bioz.com/product/a+129/TNF-%CE%B1+Antibody%2C+anti-human%2C+REAfinity/pm40442732-85-13-14
Average 95 stars, based on 1 article reviews
tnf α - by Bioz Stars, 2026-10
95/100 stars
  Buy from Supplier

94
Miltenyi Biotec pe conjugated anti ntb a

Pe Conjugated Anti Ntb A, supplied by Miltenyi Biotec, used in various techniques. Bioz Stars score: 94/100, based on 1 PubMed citations. ZERO BIAS - scores, article reviews, protocol conditions and more
https://www.bioz.com/product/a+129/CD352+(NTB-A)+Antibody%2C+anti-human%2C+REAfinity/pm38298098-333-117-121
Average 94 stars, based on 1 article reviews
pe conjugated anti ntb a - by Bioz Stars, 2026-10
94/100 stars
  Buy from Supplier

92
StressMarq against α syn pser129

Against α Syn Pser129, supplied by StressMarq, used in various techniques. Bioz Stars score: 92/100, based on 1 PubMed citations. ZERO BIAS - scores, article reviews, protocol conditions and more
https://www.bioz.com/product/a+129/Anti-Alpha+Synuclein+Antibody/us11098108-425-45-44
Average 92 stars, based on 1 article reviews
against α syn pser129 - by Bioz Stars, 2026-10
92/100 stars
  Buy from Supplier

93
StressMarq phosphorylated alpha synuclein s129 pasyn s129
A. Representative images of the GFAP (1:1000)- stained astrocytes and aSynuclein (1:200). B. Histogram of the percentage of GFAP-positive cells’ quantification. C. Histogram of GFAP fluorescence intensity quantification. D. Histogram of GFAP cell area quantification. E. Histogram of aSyn fluorescence intensity quantification. F. Histogram of <t>paSyn</t> <t>S129</t> fluorescence intensity quantification. Images were acquired on a confocal point scanning microscope, (Zeiss LSM 900 with Airyscan 2), with a 20x objective for whole dentate gyrus imaging and a 63x objective for zooming in on the astrocytic cells. The scale bar is 100 µm or 50 µm for stained images. Values are the mean ± SD for n=3-8 for all groups. The symbols denote statistically significant differences inter groups: Ctrl PBS vs IntPb PBS/PerPb PBS; Ctrl aSyn vs IntPb aSyn/PerPb aSyn - *p < 0.05, **p < 0.01, ***p < 0.001, ****p < 0.0001; Ctrl PBS vs IntPb aSyn/PerPb aSyn; Ctrl aSyn vs IntPb PBS/PerPb PBS - # p < 0.05, ## p < 0.01, ### p < 0.001, #### p < 0.0001; Ctrl PBS vs Ctrl aSyn/ IntPb PBS vs IntPb aSyn/ PerPb PBS vs PerPb aSyn - $ p < 0.05, $$ p < 0.01, $$$ p < 0.001, $$$$ p < 0.0001; one-way ANOVA, Tuckey’s multiple comparison test.
Phosphorylated Alpha Synuclein S129 Pasyn S129, supplied by StressMarq, used in various techniques. Bioz Stars score: 93/100, based on 1 PubMed citations. ZERO BIAS - scores, article reviews, protocol conditions and more
https://www.bioz.com/product/a+129/Anti-Alpha+Synuclein+Antibody/bio_rxiv__2024__10__10__617554-163-70-79
Average 93 stars, based on 1 article reviews
phosphorylated alpha synuclein s129 pasyn s129 - by Bioz Stars, 2026-10
93/100 stars
  Buy from Supplier

96
Chem Impex International dipalmitoylphosphatidylcholine
A. Representative images of the GFAP (1:1000)- stained astrocytes and aSynuclein (1:200). B. Histogram of the percentage of GFAP-positive cells’ quantification. C. Histogram of GFAP fluorescence intensity quantification. D. Histogram of GFAP cell area quantification. E. Histogram of aSyn fluorescence intensity quantification. F. Histogram of <t>paSyn</t> <t>S129</t> fluorescence intensity quantification. Images were acquired on a confocal point scanning microscope, (Zeiss LSM 900 with Airyscan 2), with a 20x objective for whole dentate gyrus imaging and a 63x objective for zooming in on the astrocytic cells. The scale bar is 100 µm or 50 µm for stained images. Values are the mean ± SD for n=3-8 for all groups. The symbols denote statistically significant differences inter groups: Ctrl PBS vs IntPb PBS/PerPb PBS; Ctrl aSyn vs IntPb aSyn/PerPb aSyn - *p < 0.05, **p < 0.01, ***p < 0.001, ****p < 0.0001; Ctrl PBS vs IntPb aSyn/PerPb aSyn; Ctrl aSyn vs IntPb PBS/PerPb PBS - # p < 0.05, ## p < 0.01, ### p < 0.001, #### p < 0.0001; Ctrl PBS vs Ctrl aSyn/ IntPb PBS vs IntPb aSyn/ PerPb PBS vs PerPb aSyn - $ p < 0.05, $$ p < 0.01, $$$ p < 0.001, $$$$ p < 0.0001; one-way ANOVA, Tuckey’s multiple comparison test.
Dipalmitoylphosphatidylcholine, supplied by Chem Impex International, used in various techniques. Bioz Stars score: 96/100, based on 1 PubMed citations. ZERO BIAS - scores, article reviews, protocol conditions and more
https://www.bioz.com/product/a+129/L-a-Phosphatidylcholine+dipalmitoyl/pm40732666-86-13-15
Average 96 stars, based on 1 article reviews
dipalmitoylphosphatidylcholine - by Bioz Stars, 2026-10
96/100 stars
  Buy from Supplier

88
European Directorate for the Quality of Medicines and HealthCare statistics package combistats 5 0
A. Representative images of the GFAP (1:1000)- stained astrocytes and aSynuclein (1:200). B. Histogram of the percentage of GFAP-positive cells’ quantification. C. Histogram of GFAP fluorescence intensity quantification. D. Histogram of GFAP cell area quantification. E. Histogram of aSyn fluorescence intensity quantification. F. Histogram of <t>paSyn</t> <t>S129</t> fluorescence intensity quantification. Images were acquired on a confocal point scanning microscope, (Zeiss LSM 900 with Airyscan 2), with a 20x objective for whole dentate gyrus imaging and a 63x objective for zooming in on the astrocytic cells. The scale bar is 100 µm or 50 µm for stained images. Values are the mean ± SD for n=3-8 for all groups. The symbols denote statistically significant differences inter groups: Ctrl PBS vs IntPb PBS/PerPb PBS; Ctrl aSyn vs IntPb aSyn/PerPb aSyn - *p < 0.05, **p < 0.01, ***p < 0.001, ****p < 0.0001; Ctrl PBS vs IntPb aSyn/PerPb aSyn; Ctrl aSyn vs IntPb PBS/PerPb PBS - # p < 0.05, ## p < 0.01, ### p < 0.001, #### p < 0.0001; Ctrl PBS vs Ctrl aSyn/ IntPb PBS vs IntPb aSyn/ PerPb PBS vs PerPb aSyn - $ p < 0.05, $$ p < 0.01, $$$ p < 0.001, $$$$ p < 0.0001; one-way ANOVA, Tuckey’s multiple comparison test.
Statistics Package Combistats 5 0, supplied by European Directorate for the Quality of Medicines and HealthCare, used in various techniques. Bioz Stars score: 88/100, based on 1 PubMed citations. ZERO BIAS - scores, article reviews, protocol conditions and more
https://www.bioz.com/product/a+129/Glycerol+monostearate+40-55+CRS/pmc05620603-161-16-20
Average 88 stars, based on 1 article reviews
statistics package combistats 5 0 - by Bioz Stars, 2026-10
88/100 stars
  Buy from Supplier

90
Celera sequenced more than a billion base pairs of the 129/svj mouse strain
A. Representative images of the GFAP (1:1000)- stained astrocytes and aSynuclein (1:200). B. Histogram of the percentage of GFAP-positive cells’ quantification. C. Histogram of GFAP fluorescence intensity quantification. D. Histogram of GFAP cell area quantification. E. Histogram of aSyn fluorescence intensity quantification. F. Histogram of <t>paSyn</t> <t>S129</t> fluorescence intensity quantification. Images were acquired on a confocal point scanning microscope, (Zeiss LSM 900 with Airyscan 2), with a 20x objective for whole dentate gyrus imaging and a 63x objective for zooming in on the astrocytic cells. The scale bar is 100 µm or 50 µm for stained images. Values are the mean ± SD for n=3-8 for all groups. The symbols denote statistically significant differences inter groups: Ctrl PBS vs IntPb PBS/PerPb PBS; Ctrl aSyn vs IntPb aSyn/PerPb aSyn - *p < 0.05, **p < 0.01, ***p < 0.001, ****p < 0.0001; Ctrl PBS vs IntPb aSyn/PerPb aSyn; Ctrl aSyn vs IntPb PBS/PerPb PBS - # p < 0.05, ## p < 0.01, ### p < 0.001, #### p < 0.0001; Ctrl PBS vs Ctrl aSyn/ IntPb PBS vs IntPb aSyn/ PerPb PBS vs PerPb aSyn - $ p < 0.05, $$ p < 0.01, $$$ p < 0.001, $$$$ p < 0.0001; one-way ANOVA, Tuckey’s multiple comparison test.
Sequenced More Than A Billion Base Pairs Of The 129/Svj Mouse Strain, supplied by Celera, used in various techniques. Bioz Stars score: 90/100, based on 1 PubMed citations. ZERO BIAS - scores, article reviews, protocol conditions and more
https://www.bioz.com/product/a+129/sequenced+more+than+a+billion+base+pairs+of+the+129+svj+mouse+strain/pm10864287-65-20-2
Average 90 stars, based on 1 article reviews
sequenced more than a billion base pairs of the 129/svj mouse strain - by Bioz Stars, 2026-10
90/100 stars
  Buy from Supplier

90
Alpha Laboratories latrunculin a 129-04361
Exocytosis Defects in Wild-Type and gef1Δ Cells after Orb6 Inhibition (A) Video time points of mCherry-Bgs4 after combining actin <t>depolymerization</t> by latrunculin A (LatA) with Orb6 inhibition. Prior disruption of endocytosis by LatA prevents loss of Bgs4 from cell tips after Orb6 inhibition (compare with <xref ref-type=Figure 2 A). shows more cells, including this cell, together with gef1Δ cells treated in the same way. (B) Secretion of acid phosphatase (ACP) activity into culture medium in indicated strains after treatment with methanol (left) or 30 μM 3-BrB-PP1 (right). Graphs show mean ACP activity normalized to cell density from replicate experiments. Error bars show SEM. (C) Fluorescence recovery after photobleaching (FRAP) of plasma membrane t-SNARE GFP-Psy1 at cell tips in orb6-as2 cells under the indicated conditions. The top-left diagram shows the target bleaching zone (magenta), line scan along the plasma membrane (green), and bleached portion of the plasma membrane (orange). The top images are from representative experiments. The bottom images are corresponding kymographs based on the line scan and bleached portion shown in the diagram. (D) Quantification of FRAP from experiments as in (C) (see ). Symbols indicate mean values. Error bars indicate SD. n indicates the number of cells analyzed. Scale bars, 10 μm. The imaging experiment for (A) was performed once. For (B), four biological replicates were performed for wild-type and orb6-as2 cells, and two biological replicates were performed for orb6-as2 gef1Δ cells. Two biological replicates of FRAP imaging were performed for (C). " width="250" height="auto" />
Latrunculin A 129 04361, supplied by Alpha Laboratories, used in various techniques. Bioz Stars score: 90/100, based on 1 PubMed citations. ZERO BIAS - scores, article reviews, protocol conditions and more
https://www.bioz.com/product/a+129/latrunculin+a+129+04361/pmc06367570-446-1-5
Average 90 stars, based on 1 article reviews
latrunculin a 129-04361 - by Bioz Stars, 2026-10
90/100 stars
  Buy from Supplier

90
Jima Inc control mimic con-129
Exocytosis Defects in Wild-Type and gef1Δ Cells after Orb6 Inhibition (A) Video time points of mCherry-Bgs4 after combining actin <t>depolymerization</t> by latrunculin A (LatA) with Orb6 inhibition. Prior disruption of endocytosis by LatA prevents loss of Bgs4 from cell tips after Orb6 inhibition (compare with <xref ref-type=Figure 2 A). shows more cells, including this cell, together with gef1Δ cells treated in the same way. (B) Secretion of acid phosphatase (ACP) activity into culture medium in indicated strains after treatment with methanol (left) or 30 μM 3-BrB-PP1 (right). Graphs show mean ACP activity normalized to cell density from replicate experiments. Error bars show SEM. (C) Fluorescence recovery after photobleaching (FRAP) of plasma membrane t-SNARE GFP-Psy1 at cell tips in orb6-as2 cells under the indicated conditions. The top-left diagram shows the target bleaching zone (magenta), line scan along the plasma membrane (green), and bleached portion of the plasma membrane (orange). The top images are from representative experiments. The bottom images are corresponding kymographs based on the line scan and bleached portion shown in the diagram. (D) Quantification of FRAP from experiments as in (C) (see ). Symbols indicate mean values. Error bars indicate SD. n indicates the number of cells analyzed. Scale bars, 10 μm. The imaging experiment for (A) was performed once. For (B), four biological replicates were performed for wild-type and orb6-as2 cells, and two biological replicates were performed for orb6-as2 gef1Δ cells. Two biological replicates of FRAP imaging were performed for (C). " width="250" height="auto" />
Control Mimic Con 129, supplied by Jima Inc, used in various techniques. Bioz Stars score: 90/100, based on 1 PubMed citations. ZERO BIAS - scores, article reviews, protocol conditions and more
https://www.bioz.com/product/a+129/a+control+mimic++con+129+/pm29061187-61-18-21
Average 90 stars, based on 1 article reviews
control mimic con-129 - by Bioz Stars, 2026-10
90/100 stars
  Buy from Supplier

Image Search Results


Journal: Cell

Article Title: Spatial proteogenomics reveals distinct and evolutionarily conserved hepatic macrophage niches

doi: 10.1016/j.cell.2021.12.018

Figure Lengend Snippet:

Article Snippet: Anti-Human S100A8 (REA917) PE , Miltenyi Biotec , 130-115-253; RRID: AB_2726963.

Techniques: Purification, Recombinant, Staining, cDNA Synthesis, Gene Expression, Software, Microscopy

A. Representative images of the GFAP (1:1000)- stained astrocytes and aSynuclein (1:200). B. Histogram of the percentage of GFAP-positive cells’ quantification. C. Histogram of GFAP fluorescence intensity quantification. D. Histogram of GFAP cell area quantification. E. Histogram of aSyn fluorescence intensity quantification. F. Histogram of paSyn S129 fluorescence intensity quantification. Images were acquired on a confocal point scanning microscope, (Zeiss LSM 900 with Airyscan 2), with a 20x objective for whole dentate gyrus imaging and a 63x objective for zooming in on the astrocytic cells. The scale bar is 100 µm or 50 µm for stained images. Values are the mean ± SD for n=3-8 for all groups. The symbols denote statistically significant differences inter groups: Ctrl PBS vs IntPb PBS/PerPb PBS; Ctrl aSyn vs IntPb aSyn/PerPb aSyn - *p < 0.05, **p < 0.01, ***p < 0.001, ****p < 0.0001; Ctrl PBS vs IntPb aSyn/PerPb aSyn; Ctrl aSyn vs IntPb PBS/PerPb PBS - # p < 0.05, ## p < 0.01, ### p < 0.001, #### p < 0.0001; Ctrl PBS vs Ctrl aSyn/ IntPb PBS vs IntPb aSyn/ PerPb PBS vs PerPb aSyn - $ p < 0.05, $$ p < 0.01, $$$ p < 0.001, $$$$ p < 0.0001; one-way ANOVA, Tuckey’s multiple comparison test.

Journal: bioRxiv

Article Title: Lead as a toxic environmental toxicant in models of synucleinopathies

doi: 10.1101/2024.10.10.617554

Figure Lengend Snippet: A. Representative images of the GFAP (1:1000)- stained astrocytes and aSynuclein (1:200). B. Histogram of the percentage of GFAP-positive cells’ quantification. C. Histogram of GFAP fluorescence intensity quantification. D. Histogram of GFAP cell area quantification. E. Histogram of aSyn fluorescence intensity quantification. F. Histogram of paSyn S129 fluorescence intensity quantification. Images were acquired on a confocal point scanning microscope, (Zeiss LSM 900 with Airyscan 2), with a 20x objective for whole dentate gyrus imaging and a 63x objective for zooming in on the astrocytic cells. The scale bar is 100 µm or 50 µm for stained images. Values are the mean ± SD for n=3-8 for all groups. The symbols denote statistically significant differences inter groups: Ctrl PBS vs IntPb PBS/PerPb PBS; Ctrl aSyn vs IntPb aSyn/PerPb aSyn - *p < 0.05, **p < 0.01, ***p < 0.001, ****p < 0.0001; Ctrl PBS vs IntPb aSyn/PerPb aSyn; Ctrl aSyn vs IntPb PBS/PerPb PBS - # p < 0.05, ## p < 0.01, ### p < 0.001, #### p < 0.0001; Ctrl PBS vs Ctrl aSyn/ IntPb PBS vs IntPb aSyn/ PerPb PBS vs PerPb aSyn - $ p < 0.05, $$ p < 0.01, $$$ p < 0.001, $$$$ p < 0.0001; one-way ANOVA, Tuckey’s multiple comparison test.

Article Snippet: Succinctly, free-floating sections were washed with TBS 1x (PanReac/AppliChem, Germany), permeabilized with 3% Triton X 100 solution for 15min (Carl Roth, Germany) and blocked with 5% Goat Serum (BioWest, France) and 1% Bovine serum (VWR, USA) for 1 h. The freely floating tissue were then incubated with specific combinations of primary antibodies [astrocytes - glial fibrillary acidic protein - GFAP (chicken, ab4674, abcam, 1:500), alpha synuclein (mouse, 610787, BD Biosciences), phosphorylated alpha synuclein S129 – paSyn S129 (rabbit, SMC-600, StressMarq), Tyrosine Hydroxylase - TH (mouse, MAB5280, Milipore) and Tyrosine Hydroxylase – TH (rabbit, AB152, Milipore)] overnight at 4°C on a shaker.

Techniques: Staining, Fluorescence, Microscopy, Imaging, Comparison
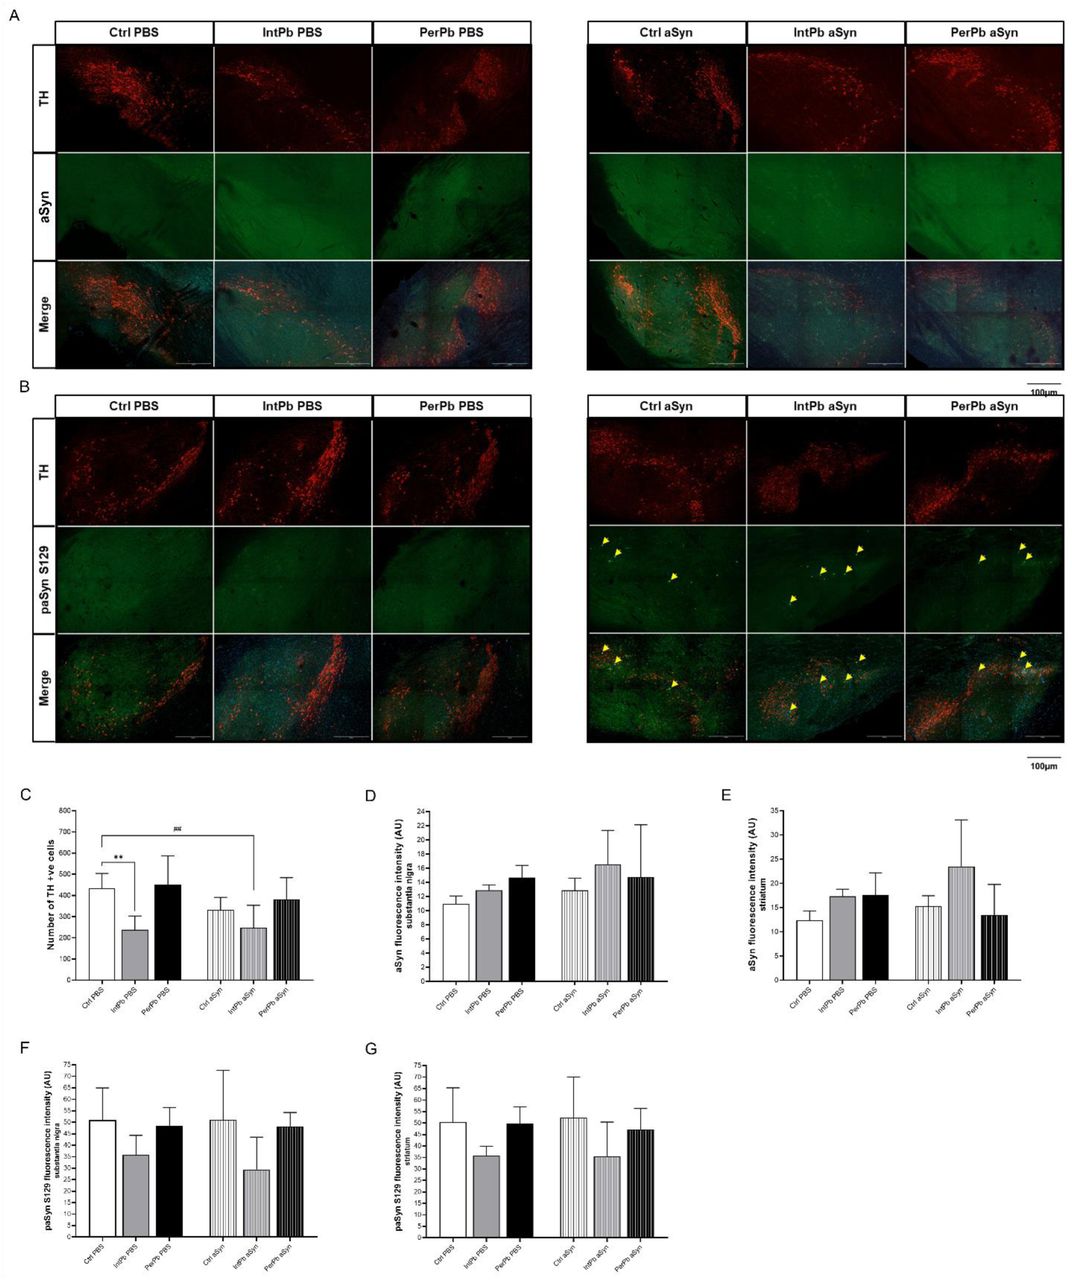
A. Representative images of the TH (1:500)-stained dopaminergic neurons and aSyn (1:200) in the substantia nigra. B. Representative images of the TH (1:500)-stained dopaminergic neurons and paSyn S129 (1:200) in the substantia nigra. C. Histogram of the quantification of TH+ve cells. D. Histogram of quantification of aSyn fluorescence intensity in substantia nigra. E. Histogram of quantification of aSyn fluorescence intensity in striatum. F. Histogram of quantification of paSyn S129 fluorescence intensity in substantia nigra G. Histogram of quantification of paSyn S129 fluorescence intensity in striatum. Images were acquired on a confocal point scanning microscope, (Zeiss LSM 900 with Airyscan 2), with a 10x objective. The scale bar is 100 µm for stained images. Values are the mean ± SD for n=4-8 for all groups. The symbols denote statistically significant differences inter groups: Ctrl PBS vs IntPb PBS/PerPb PBS; Ctrl aSyn vs IntPb aSyn/PerPb aSyn - *p < 0.05, **p < 0.01, ***p < 0.001, ****p < 0.0001; Ctrl PBS vs IntPb aSyn/PerPb aSyn; Ctrl aSyn vs IntPb PBS/PerPb PBS - # p < 0.05, ## p < 0.01, ### p < 0.001, #### p < 0.0001; one-way ANOVA, Tuckey’s multiple comparison test.

Journal: bioRxiv

Article Title: Lead as a toxic environmental toxicant in models of synucleinopathies

doi: 10.1101/2024.10.10.617554

Figure Lengend Snippet: A. Representative images of the TH (1:500)-stained dopaminergic neurons and aSyn (1:200) in the substantia nigra. B. Representative images of the TH (1:500)-stained dopaminergic neurons and paSyn S129 (1:200) in the substantia nigra. C. Histogram of the quantification of TH+ve cells. D. Histogram of quantification of aSyn fluorescence intensity in substantia nigra. E. Histogram of quantification of aSyn fluorescence intensity in striatum. F. Histogram of quantification of paSyn S129 fluorescence intensity in substantia nigra G. Histogram of quantification of paSyn S129 fluorescence intensity in striatum. Images were acquired on a confocal point scanning microscope, (Zeiss LSM 900 with Airyscan 2), with a 10x objective. The scale bar is 100 µm for stained images. Values are the mean ± SD for n=4-8 for all groups. The symbols denote statistically significant differences inter groups: Ctrl PBS vs IntPb PBS/PerPb PBS; Ctrl aSyn vs IntPb aSyn/PerPb aSyn - *p < 0.05, **p < 0.01, ***p < 0.001, ****p < 0.0001; Ctrl PBS vs IntPb aSyn/PerPb aSyn; Ctrl aSyn vs IntPb PBS/PerPb PBS - # p < 0.05, ## p < 0.01, ### p < 0.001, #### p < 0.0001; one-way ANOVA, Tuckey’s multiple comparison test.

Article Snippet: Succinctly, free-floating sections were washed with TBS 1x (PanReac/AppliChem, Germany), permeabilized with 3% Triton X 100 solution for 15min (Carl Roth, Germany) and blocked with 5% Goat Serum (BioWest, France) and 1% Bovine serum (VWR, USA) for 1 h. The freely floating tissue were then incubated with specific combinations of primary antibodies [astrocytes - glial fibrillary acidic protein - GFAP (chicken, ab4674, abcam, 1:500), alpha synuclein (mouse, 610787, BD Biosciences), phosphorylated alpha synuclein S129 – paSyn S129 (rabbit, SMC-600, StressMarq), Tyrosine Hydroxylase - TH (mouse, MAB5280, Milipore) and Tyrosine Hydroxylase – TH (rabbit, AB152, Milipore)] overnight at 4°C on a shaker.

Techniques: Staining, Fluorescence, Microscopy, Comparison

Exocytosis Defects in Wild-Type and gef1Δ Cells after Orb6 Inhibition (A) Video time points of mCherry-Bgs4 after combining actin depolymerization by latrunculin A (LatA) with Orb6 inhibition. Prior disruption of endocytosis by LatA prevents loss of Bgs4 from cell tips after Orb6 inhibition (compare with <xref ref-type=Figure 2 A). shows more cells, including this cell, together with gef1Δ cells treated in the same way. (B) Secretion of acid phosphatase (ACP) activity into culture medium in indicated strains after treatment with methanol (left) or 30 μM 3-BrB-PP1 (right). Graphs show mean ACP activity normalized to cell density from replicate experiments. Error bars show SEM. (C) Fluorescence recovery after photobleaching (FRAP) of plasma membrane t-SNARE GFP-Psy1 at cell tips in orb6-as2 cells under the indicated conditions. The top-left diagram shows the target bleaching zone (magenta), line scan along the plasma membrane (green), and bleached portion of the plasma membrane (orange). The top images are from representative experiments. The bottom images are corresponding kymographs based on the line scan and bleached portion shown in the diagram. (D) Quantification of FRAP from experiments as in (C) (see ). Symbols indicate mean values. Error bars indicate SD. n indicates the number of cells analyzed. Scale bars, 10 μm. The imaging experiment for (A) was performed once. For (B), four biological replicates were performed for wild-type and orb6-as2 cells, and two biological replicates were performed for orb6-as2 gef1Δ cells. Two biological replicates of FRAP imaging were performed for (C). " width="100%" height="100%">

Journal: Cell Reports

Article Title: Fission Yeast NDR/LATS Kinase Orb6 Regulates Exocytosis via Phosphorylation of the Exocyst Complex

doi: 10.1016/j.celrep.2019.01.027

Figure Lengend Snippet: Exocytosis Defects in Wild-Type and gef1Δ Cells after Orb6 Inhibition (A) Video time points of mCherry-Bgs4 after combining actin depolymerization by latrunculin A (LatA) with Orb6 inhibition. Prior disruption of endocytosis by LatA prevents loss of Bgs4 from cell tips after Orb6 inhibition (compare with Figure 2 A). shows more cells, including this cell, together with gef1Δ cells treated in the same way. (B) Secretion of acid phosphatase (ACP) activity into culture medium in indicated strains after treatment with methanol (left) or 30 μM 3-BrB-PP1 (right). Graphs show mean ACP activity normalized to cell density from replicate experiments. Error bars show SEM. (C) Fluorescence recovery after photobleaching (FRAP) of plasma membrane t-SNARE GFP-Psy1 at cell tips in orb6-as2 cells under the indicated conditions. The top-left diagram shows the target bleaching zone (magenta), line scan along the plasma membrane (green), and bleached portion of the plasma membrane (orange). The top images are from representative experiments. The bottom images are corresponding kymographs based on the line scan and bleached portion shown in the diagram. (D) Quantification of FRAP from experiments as in (C) (see ). Symbols indicate mean values. Error bars indicate SD. n indicates the number of cells analyzed. Scale bars, 10 μm. The imaging experiment for (A) was performed once. For (B), four biological replicates were performed for wild-type and orb6-as2 cells, and two biological replicates were performed for orb6-as2 gef1Δ cells. Two biological replicates of FRAP imaging were performed for (C).

Article Snippet: For actin depolymerization, Latrunculin A (Alpha laboratories; 129-04361) was added to cells at a final concentration of 50 μM in growth medium (made from a 25 mM stock in DMSO), 10 min before addition of 3-BrB-PP1.

Techniques: Inhibition, Disruption, Activity Assay, Fluorescence, Clinical Proteomics, Membrane, Imaging